
python可视化花式使用柱状图——使用matplotlib绘制简单图形bar和barh示例
话不多说,看图看代码,就是最大的享受。源码1:# -*- coding: utf-8 -*-import matplotlib.pyplot as pltnum_list = [2.5, 0.6, 3.8, 6.6,1.2,9.5,4.2]# plt.bar( range( len( num_list ) ), num_list, fc='r' )#设定颜色全红,太简单了,省略name_list
·
话不多说,看图看代码,就是最大的享受。
源码1:
# -*- coding: utf-8 -*-
import matplotlib.pyplot as plt

num_list = [2.5, 0.6, 3.8, 6.6,1.2,9.5,4.2]

# plt.bar( range( len( num_list ) ), num_list, fc='r' )
#设定颜色全红,太简单了,省略
name_list = ['Monday','Tuesday','Wednesday','Thursday','Friday','Saturday','Sunday']
plt.bar(range(len(num_list)), num_list,color='rgbybgr',tick_label=name_list)
#设置真彩rgb任意颜色以及标签name_list列表
plt.show()
堆叠一把:
# -*- coding: utf-8 -*-
import matplotlib.pyplot as plt
# import warnings
# warnings.simplefilter("error")


num_list1 = [2.5, 0.6, 3.8, 6.6,1.2,9.5,4.2]
num_list2 = [ 6.6,1.2,9.5,4.2,2.5, 0.6, 3.8]


# plt.bar( range( len( num_list1 ) ), num_list1, fc='r' )#设定颜色全红

name_list = ['Monday','Tuesday','Wednesday','Thursday','Friday','Saturday','Sunday']

plt.bar(range(len(num_list1)), num_list1,color='rgbybgr',label='girl',tick_label=name_list)

plt.bar(range(len(num_list2)), num_list2,color='ybgbyrg',label='boy',tick_label=name_list)

#设置真彩rgb任意颜色以及标签name_list列表

plt.legend()
plt.show()
效果如图: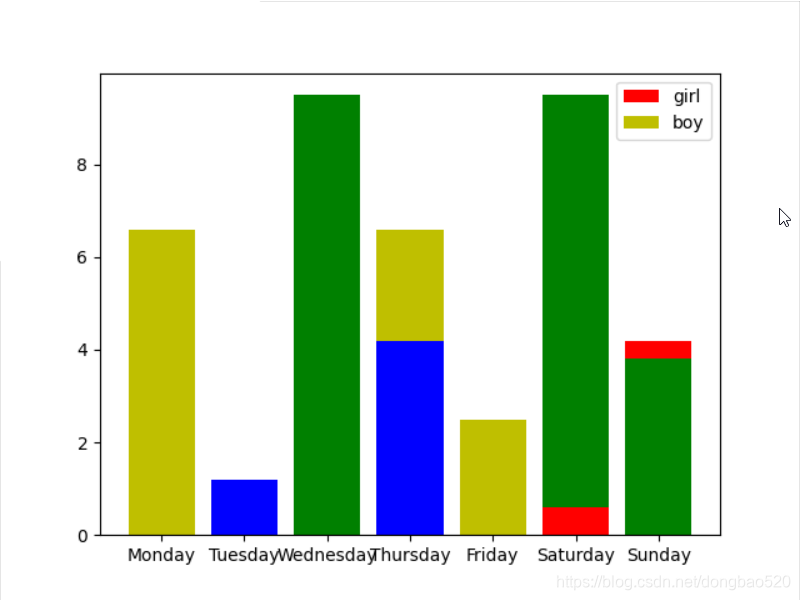
可能会报错,MatplotlibDeprecationWarning: Using a string of single character colors as a color sequence is deprecated since 3.2 and will be removed two minor releases later. Use an explicit list instead.
plt.bar(range(len(num_list1)), num_list1,color='rgbybgr',label='girl',tick_label=name_list)
修改一下:
代码如下:
```csharp
# -*- coding: utf-8 -*-
import matplotlib.pyplot as plt

num_list1 = [2.5, 0.6, 3.8, 6.6,1.2,9.5,4.2]
num_list2 = [ 6.6,1.2,9.5,4.2,2.5, 0.6, 3.8]
name_list = ['Monday','Tuesday','Wednesday','Thursday','Friday','Saturday','Sunday']
num_list2,color='ybgbyrg',label='boy',tick_label=name_list)

plt.bar(range(len(num_list1)), num_list1,label='girl',fc='r')

plt.bar(range(len(num_list1)), num_list2,fc='b',label='boy',tick_label=name_list)
plt.legend()
plt.show()

还是有点小bug,不晓得哪里不对劲。。我的意思是除了覆盖掉的。换种思路来看,冰山堆叠。
```csharp
# -*- coding: utf-8 -*-
import matplotlib.pyplot as plt
num_list1 = [2.5, 0.6, 3.8, 6.6,1.2,9.5,4.2]
num_list2 = [-6.6,-1.2,-3.5,-4.2,-2.5, -3.6, -10]
name_list = ['Monday','Tuesday','Wednesday','Thursday','Friday','Saturday','Sunday']
plt.bar(range(len(num_list1)), num_list1,color='r',label='girl',tick_label=name_list)
plt.bar(range(len(num_list2)), num_list2,color='y',label='boy',tick_label=name_list)
plt.legend()
plt.show()
上下倒影式。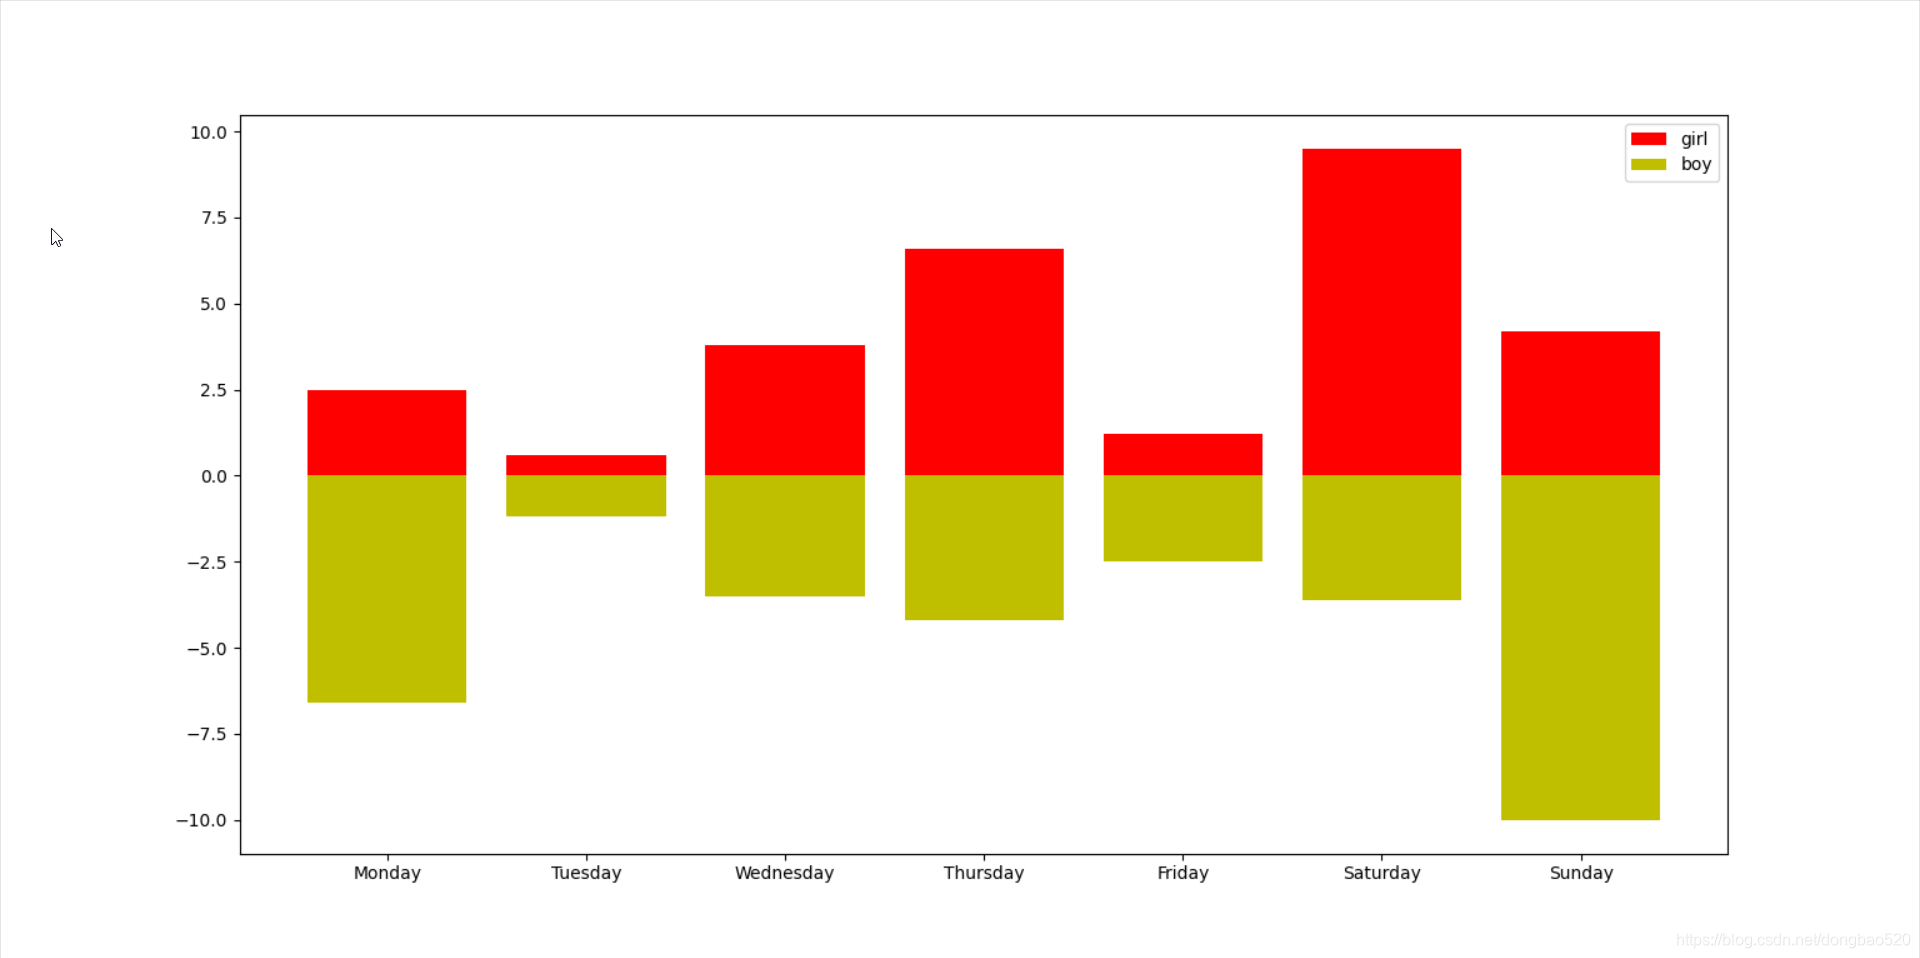
转置图形,换位之后: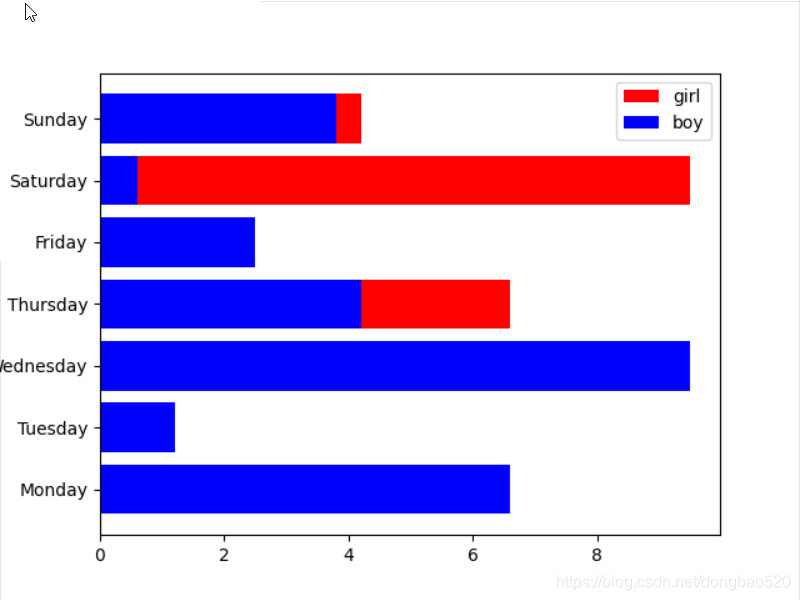
条状图
# -*- coding: utf-8 -*-
import matplotlib.pyplot as plt

num_list1 = [2.5, 0.6, 3.8, 6.6,1.2,9.5,4.2]
num_list2 = [ 6.6,1.2,9.5,4.2,2.5, 0.6, 3.8]
name_list = ['Monday','Tuesday','Wednesday','Thursday','Friday','Saturday','Sunday']
num_list2,color='ybgbyrg',label='boy',tick_label=name_list)

plt.barh(range(len(num_list1)), num_list1,label='girl',fc='r')

plt.barh(range(len(num_list1)), num_list2,fc='b',label='boy',tick_label=name_list)
plt.legend()
plt.show()
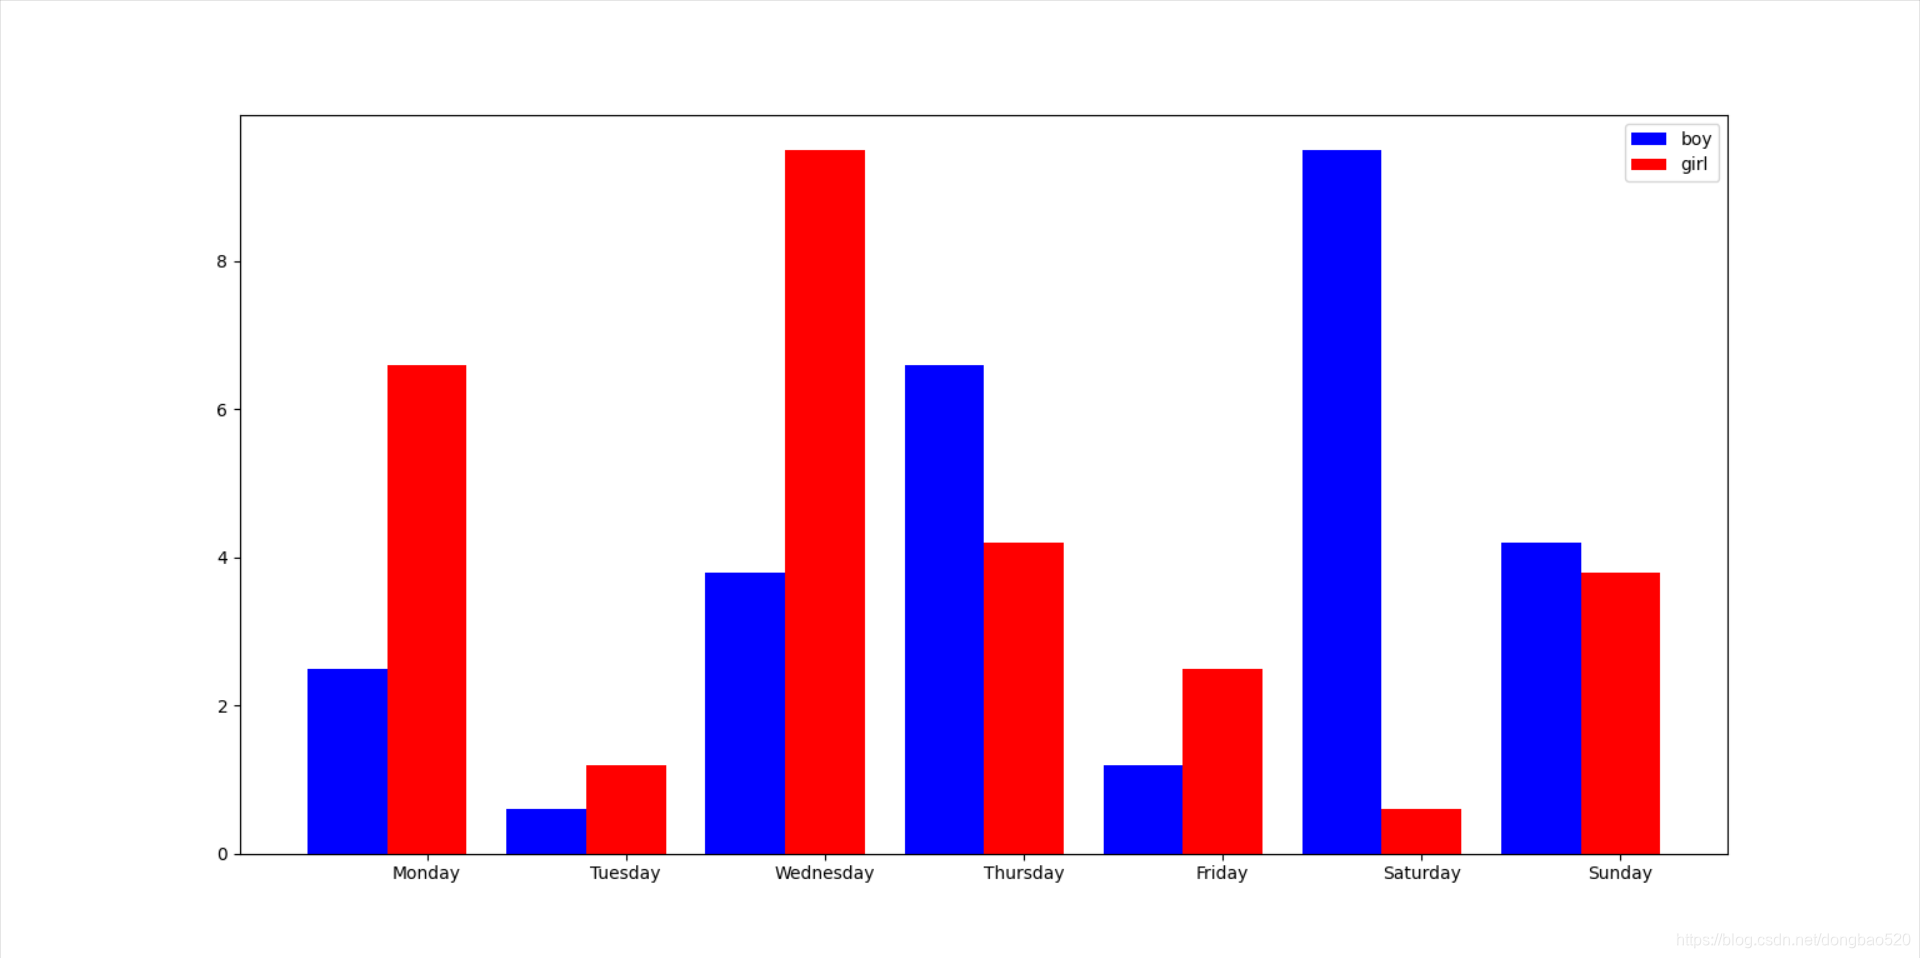
并列转换柱状图:
# -*- coding: utf-8 -*-
import matplotlib.pyplot as plt

num_list = [2.5, 0.6, 3.8, 6.6,1.2,9.5,4.2]
num_list2 = [ 6.6,1.2,9.5,4.2,2.5, 0.6, 3.8]

name_list = ['Monday','Tuesday','Wednesday','Thursday','Friday','Saturday','Sunday']

num_list2,color='ybgbyrg',label='boy',tick_label=name_list)

x = list( range( len( num_list ) ) )
total_width, n = 0.8, 2
width = total_width / n

plt.bar( x, num_list, width=width, label='boy', fc='b' )
for i in range( len( x ) ):
    x[i] = x[i] + width
plt.bar( x, num_list2, width=width, label='girl', tick_label=name_list, fc='r' )
plt.legend()
plt.show()

plt.legend()
plt.show()
效果如图
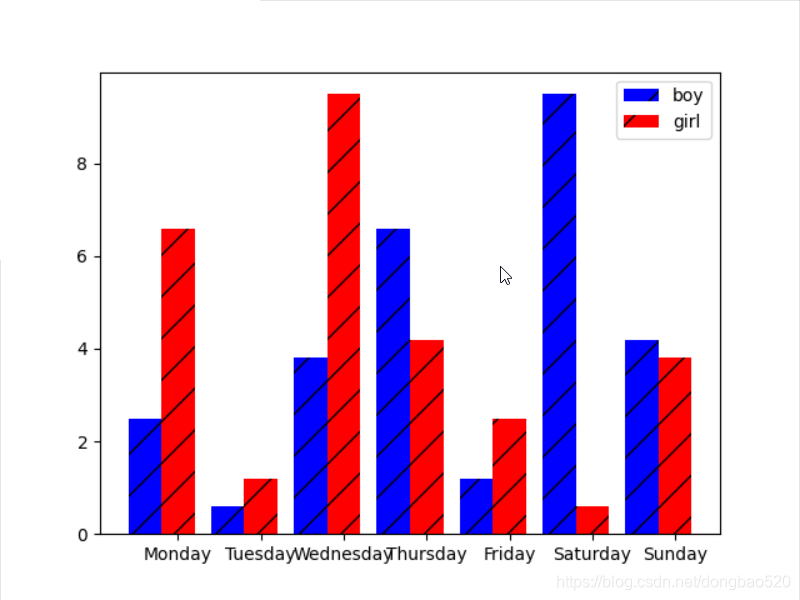
进化一波:
# -*- coding: utf-8 -*-
import matplotlib.pyplot as plt

num_list = [2.5, 0.6, 3.8, 6.6,1.2,9.5,4.2]
num_list2 = [ 6.6,1.2,9.5,4.2,2.5, 0.6, 3.8]

name_list = ['Monday','Tuesday','Wednesday','Thursday','Friday','Saturday','Sunday']

num_list2,color='ybgbyrg',label='boy',tick_label=name_list)

x = list( range( len( num_list ) ) )
total_width, n = 0.8, 2
width = total_width / n

plt.bar( x, num_list, width=width, label='boy', fc='b',hatch='/'  )
for i in range( len( x ) ):
    x[i] = x[i] + width
plt.bar( x, num_list2, width=width, label='girl', tick_label=name_list, fc='r',hatch='/'  )
plt.legend()
plt.show()

GitCode 天启AI是一款由 GitCode 团队打造的智能助手,基于先进的LLM(大语言模型)与多智能体 Agent 技术构建,致力于为用户提供高效、智能、多模态的创作与开发支持。它不仅支持自然语言对话,还具备处理文件、生成 PPT、撰写分析报告、开发 Web 应用等多项能力,真正做到“一句话,让 Al帮你完成复杂任务”。
更多推荐

 2
2 0
0- 0


 已为社区贡献4条内容

所有评论(0)