
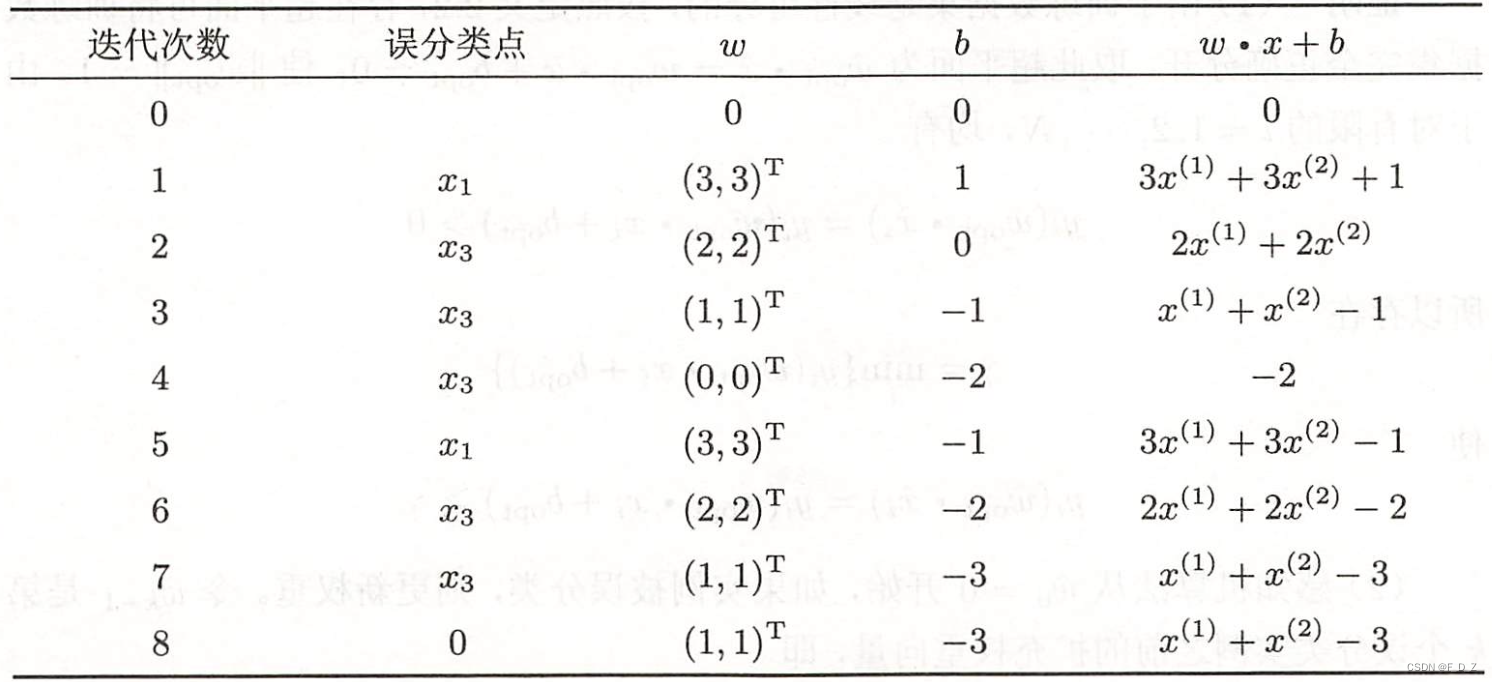
Python 双y轴绘制
利用Python中matplotlib绘制双y轴图。关键函数:Axes.twinx()测试代码:import numpy as npimport matplotlib.pyplot as plt# Create some mock datat = np.arange(0.01, 10.0, 0.01)data1 = np.exp(t)data2 = np.sin(2 * np.pi * t)fig
·
利用Python中matplotlib绘制双y轴图。
关键函数:Axes.twinx()
测试代码:
import numpy as np
import matplotlib.pyplot as plt

# Create some mock data
t = np.arange(0.01, 10.0, 0.01)
data1 = np.exp(t)
data2 = np.sin(2 * np.pi * t)

fig, ax1 = plt.subplots()

color = 'tab:red'
ax1.set_xlabel('time (s)')
ax1.set_ylabel('exp', color=color)
ax1.plot(t, data1, color=color)
ax1.tick_params(axis='y', labelcolor=color)

ax2 = ax1.twinx()  # instantiate a second axes that shares the same x-axis

color = 'tab:blue'
ax2.set_ylabel('sin', color=color)  # we already handled the x-label with ax1
ax2.plot(t, data2, color=color)
ax2.tick_params(axis='y', labelcolor=color)

fig.tight_layout()  # otherwise the right y-label is slightly clipped
plt.show()
参考:https://www.cnblogs.com/Atanisi/p/8530693.html
Plots with different scales:https://matplotlib.org/stable/gallery/subplots_axes_and_figures/two_scales.html#sphx-glr-gallery-subplots-axes-and-figures-two-scales-py

GitCode 天启AI是一款由 GitCode 团队打造的智能助手,基于先进的LLM(大语言模型)与多智能体 Agent 技术构建,致力于为用户提供高效、智能、多模态的创作与开发支持。它不仅支持自然语言对话,还具备处理文件、生成 PPT、撰写分析报告、开发 Web 应用等多项能力,真正做到“一句话,让 Al帮你完成复杂任务”。
更多推荐

 0
0 0
0- 0


 已为社区贡献13条内容

所有评论(0)